The MySQL error log is an essential part of database server performance monitoring. Whenever something goes wrong or performance degrades, the Error Logs are usually the first place we look to start troubleshooting.
The MySQL Error Log is one of three related log types:
- The Error Log: It contains information about errors that occur while the server is running (as well as server start and stop events).
- The General Query Log: This is a general record of what mysqld is doing (connect, disconnect, queries).
- The Slow Query Log: It consists of “slow” SQL statements as defined in the long_query_time global variable.
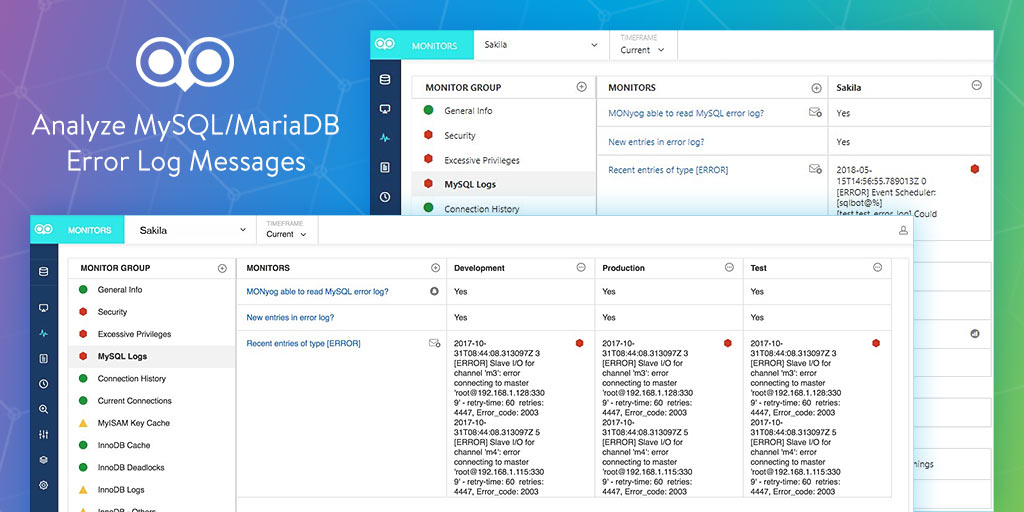
You can enable error log monitoring to allow Monyog to keep an eye on your MySQL Error Log, and notify you when something goes awry. Moreover, Monyog combines the General Query, Slow Query and Error logs in a single view for both network and cloud servers. For example, in the case of Amazon RDS, Monyog utilizes the Amazon RDS Application Programming Interface (API).
In the Error Logging in MySQL 8 blog article, we were introduced to MySQL’s new component-based architecture. This new architectural model is more modular because components may only interact with each other through the services they provide. Services provided by components are available to the server as well as to other components.
These changes have added to error logging flexibility. Case in point, log messages may now be output with a particular format and output either to a file or the system log.
The improved flexibility correlates to an equal increase configuration complexity as a log component can be a filter or a sink:
- A filter processes log events, to add, remove, or modify individual event fields, or to delete events entirely.
- A sink is a destination (writer) for log events. Typically, a sink processes log events into log messages that have a particular format and writes these messages to its associated output, such as a file or the system log.
For users of Monyog, these complexities are a non-issue, as Monyog makes error log monitoring a straight-forward process of entering log details on the Settings screen and then viewing output on the Monitors screen.
This blog will describe how to configure your MySQL/MariaDB Error Log settings, view output, and glean useful insights from error messages.
What Goes in the Error Log?
The MySQL Error Log may contain messages of varying severities. It collects messages that require persistence beyond that of a single connection or the server’s runtime, that have an intended audience of the DBA or system administrator, as opposed to the application developer. Though the latter may sometimes find the Error Log contents instructive as well. Examples of Error Log entries include exhaustion of resources on the host machine, certain errors reported by the host operating system, stack traces of crashes, messages about damaged databases and indexes, errors on start-up, failed or refused connections, etc.
The error log contains a record of mysqld startup and shutdown times. It also contains diagnostic messages such as errors, warnings, and notes that occur during server startup and shutdown, and while the server is running. For example, if mysqld comes across a table that needs to be checked or repaired, it writes a message to the error log.
On some operating systems, the error log contains a stack trace if mysqld exits abnormally. The trace can be used to determine where mysqld exited.
Configuring Error Log Settings
Monitoring the error log is crucial as changes to the log are indicative of disastrous outages. Monyog makes the task of monitoring the error log very simple. All one needs to do is configure Monyog, and it will take care of the rest! Monyog will alert you of changes in the error log, and in addition, if there is an entry of type [ERROR] in the log, Monyog will extract the corresponding message and send an email it to designated persons.
The Error Log is disabled in MySQL and MariaDB by default, so we have to enable it before Monyog can read and analyze it. To do that:
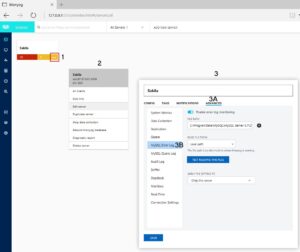
- Navigate to the SERVERS screen and click on the ellipsis […] to open the context menu (#1 in the image below).
- Choose the Edit Server item from the context menu (#2 in the image below).
- On the Server Settings dialog (#3 in the image below):
-
- Click on the ADVANCED header to bring up the advanced server settings (#3A in the image below).
- Select MySQL Server Log from the tree on the left-hand side of the dialog (#3B in the image below).
-
To configure error log monitoring:
- To Click the Enable error log monitoring toggle switch so that the slider moves to the right. The background color will also go from grey to blue:

- You can either enter the error log FILE PATH manually, or you let Monyog get the path of the error log from the MySQL server for you. Just click on the Fetch button to the right of the FILE PATH text field, and Monyog will locate the file!
- The READ FILE FROM field sets how Monyog will access the Error Log File. There are 3 ways of accessing the log files:
- Select Local path if the Error Log File resides on the same machine that Monyog is running on or on a shared network drive.
- Choose Via SFTP if you have configured Monyog to use SSH. You’ll then have to supply your SSH details.
- Select RDS/Aurora (Using API) if your server is an RDS/Aurora instance. For file-based logging, you’ll have to fill four additional fields, as follows:
- DB instance identifier: A unique name to identify your RDS/Aurora instance.
- Instance region: The region in which your instance is hosted, e.g: “us-east-1”
- Access key ID: It is a 20 character long key ID which can be created from the AWS Management console. It is used to make programmatic requests to AWS.
- Secret access key: It is 40 characters long and can be created from the AWS Management console.
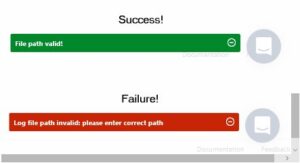
- Click the TEST READING THE FILE button to check if Monyog can access the file specified in the File path. A message will appear in the bottom right corner of the browser window:
- You can APPLY THE SETTING TO Only this server or All servers with tags same as this server.
Click the SAVE button to save your Server Settings and close the dialog.
Viewing the Error Log File
MySQL Log data is combined on the MySQL Logs screen. Like all monitors, it can show log information for multiple servers. The MySQL Logs screen is accessible via the Monitors icon (on the left-hand toolbar) > MySQL Logs (in the MONITOR GROUP list).
The MySQL Log screen displays multiple servers side-by-side:
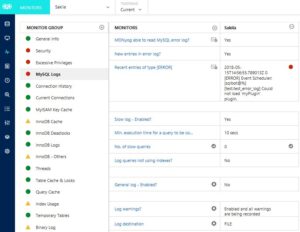
This MySQL Log screen shows the local Sakila server:
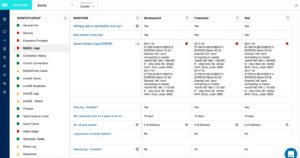
The MySQL Error Log occupies the first three rows of the MONITORS table:
- MONyog able to read MySQL error log?: A Yes/No value indicating whether Monyog is able to access the MySQL error log. If No is indicated, go back to the Error Log Settings screen and make sure that Error Log monitoring is enabled and that Monyog can read the file.
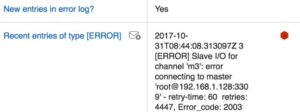
- New entries in error log?: This Yes/No value indicates whether the error log has changed during the selected TIMEFRAME.
- Recent entries of type [ERROR]: MySQL logs three kinds of Log entries – Notes, Warnings, and Errors. Any log entries recorded with an [ERROR] type are displayed here.
Getting the Most out of the MySQL Log Screen
The MySQL Log Screen does a lot more than display server errors. In addition to alerting you of changes in the error log, Monyog provides useful information about each monitor, as well as historical data. It can even extract the message from [ERROR] entries and send them to you via email.
Monitor Editing
Monitor names are actually clickable links that open the associated EDIT MONITOR screen at the right of the screen. It’s a screen where you can view and modify monitor parameters.
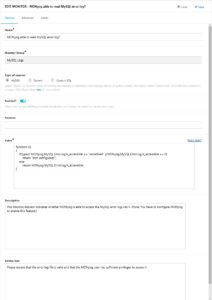
Here’s a description of the form fields. Mandatory fields are marked with an asterisk (*):
- Name*: The name of the monitor.
- Monitor Group*: The monitor group that this monitor belongs to.
- Type of counter: Choices include MySQL, System, or Custom SQL.
- MySQL or System indicate that this Monitor displays MySQL or system-related information respectively, while Custom SQL indicates that this Monitor is based on a Custom SQL Object. Only MySQL is applicable to existing Error Log monitors.
- Enabled?: A toggle switch indicating whether or not the monitor is enabled. Moving the slider to the right enables the monitor while moving it to the left turns the monitor off. The background color will also go from grey to blue when the monitor is enabled.
- Formula: A MySQL server parameter on which the value of this counter is based. None are applicable to the Error Log, so this field should normally be left blank.
- Value: This specifies a JavaScript function that computes the value. For example, this code fetches the last Error Log entry:
- function x()
{
val = MONyog.MySQL.ErrorLog.Last_error;
if(typeof val == “undefined” || val == 0 || val == “”)
return “(n/a)”;
else
return val;
} - Description: A detailed summary of the monitor.
- Advice text: Provides additional information about the monitor, such as how to interpret its output as well as how to correct potential problems.
Setting Alerts
Monyog tells you that a monitor reading could be pointing to a potential issue to investigate by placing a Red or Yellow alert next to it. For example, here is a Critical alert next to a Log Error entry:
Alert settings are configured on the Alerts tab of the EDIT MONITOR screen.
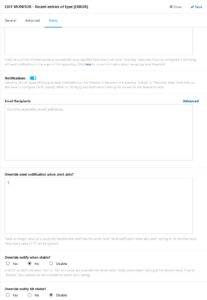
The Email Recipients textbox accepts a comma-delimited list of email addresses to send notifications to when an alert is triggered. Clicking the Advanced link divides recipients into Critical and Warning lists.
You can turn Notifications on and off via the Notifications slider control. Note that you also have to configure SMTP or(and) SNMP for MONyog and Notification Settings for servers for this feature to work.
You can also override the notification settings via the Override notify when stable? and Override notify till stable? fields. Each includes radio buttons for “Yes”, “No”, and “Disable”. If set to “Disable”, this variable will not override the server-level setting.
When notifications are enabled for a monitor, the Notifications enabled icon appears beside the monitor name:
![]()
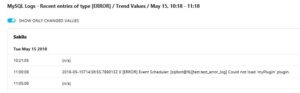
Viewing Historical Trend Values
The term “Trend Analysis” refers to the concept of collecting information in an effort to spot a pattern, or trend, in the data. With respect to database administration, analyzing history reports gives a way to track trends and identify problem areas in your infrastructure. The idea is that, by using historical information to find recurring problems, you may be able to prevent future issues.
Each server column cell has a History trend value icon on the right-hand side. Clicking it displays historical trend data for the selected TIMEFRAME.
![]()
Clicking the SHOW ONLY CHANGED VALUES slider toggles between all log entries and only those where the value has changed.

Conclusion
An essential part of database server performance monitoring, the MySQL error log is usually the first place we look to start troubleshooting database issues. In today’s blog, we learned how Monyog facilitates error log monitoring on MySQL and MariaDB servers by combining all of the log output together on one screen. Moreover, Monyog offers additional value by providing features such as Alerts, Notifications, and History Trend Values.