MariaDB came into being the day that Oracle announced the purchase of Sun in 2010. In order to keep it free under the GNU GPL, Michael Widenius forked MySQL and took several MySQL developers with him in the process. Since then, MariaDB has been a drop-in replacement for MySQL, albeit with more features and better performance.
In the Improve MariaDB Performance using Query Profiling blog, we learned some useful techniques for tracking and analyzing slow queries using a couple of MariaDB server’s built-in tools: the Slow Query Log and the Performance Schema.
The Slow Query Log records queries that are deemed to be slow and potentially problematic, that is, queries that take longer than the long_query_time global system variable value to run.
The Performance Schema is a storage engine that contains a database called performance_schema, which in turn consists of a number of tables. It may be utilized to view raw data in the summary views as well as review performance over time.
Both of the above tools come with their own pros and cons. For example, the slow query log is easy to work with and may be viewed with any text editor. The Performance Schema tables may be queried with regular SQL statements for a wide range of performance information. At the same time, both tools tend to produce a wealth of data that can be a burden to wade through.
That’s where a professional monitoring tool add tremendous value.
More than a Real-time monitoring tool, Monyog features RDS OS and file-based log monitoring, including the General Query, Slow Query and Error logs in a single view. It also lets you view RDS OS metrics like CPU Utilization, RAM usage etc. using the CloudWatch API.
Configuring the Slow Query Log
In MariaDB, as in MySQL, the Slow Query Log is disabled by default. It must be enabled by setting the slow_query_log global system variable to 1. There are a few other system variables for:
- Setting the time in seconds/microseconds that define a slow query.
- Writing to a file or table.
- Providing the name of the slow query log file.
- Logging queries that don’t use indexes.
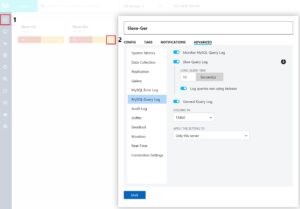
In Monyog, you can configure all of these settings via the ADVANCED tab of the Server Settings dialog. It is accessible by clicking:
- The Servers icon (#1 in the image below).
- The ellipsis on the server summary box (#2 in the image below).
- The Edit Server item from the popup (not pictured).
- The ADVANCED header (underlined in blue in the image below).
- The MySQL Query Log item (highlighted in blue in the image below).
The ADVANCED tab of the MySQL Query Log item contains settings for the General Query, Slow Query and Error logs.
The Server Settings dialog also allows us to apply the Slow Query Log settings to the current server or to all servers with tags same as the current server.
Clicking the SAVE button closes the dialog and persists the Slow Log settings.
Dashboard Metrics
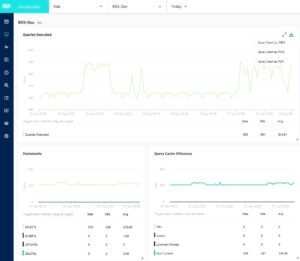
The Dashboard displays a set of charts so that DBAs can easily understand the complete security, availability, and performance picture of all their MySQL servers in one place. Monyog ships with a default dashboard called “Performance metrics”, but DBAs can create their own set of charts for database and OS specific metrics for one or more servers. These include query performance metrics such as Queries Executed, Statements, and Query Cache Efficiency.
All charts and graphs displayed on the Dashboard can be exported in PDF/JPG/PNG formats. To export a chart, click the download icon and select your preferred file format from the drop-down context menu.
Viewing MySQL Logs Details
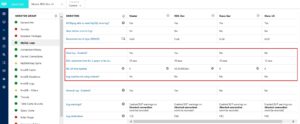
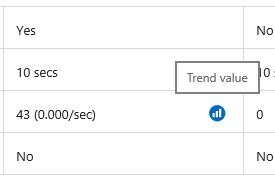
The Monyog Monitors page displays a detailed display of server parameters and metrics. Clicking the MySQL Logs item under the MONITOR GROUP header brings up details about the General Query, Slow Query (highlighted with a red box in the image below) and Error logs for monitored servers.
Slow Query information includes:
- Slow log – Enabled? (Yes/no)
- Min. execution time for a query to be considered slow, in seconds
- No. of slow queries
- Log queries not using indexes? (Yes/no)
Trend Values Graph
A graph or chart is a visual information graphic representation of tabular numeric data. Graphs are often used to make it easier to understand large quantities of data and the relationship between different parts of the data. Graphs can usually be read more quickly than the raw data that they come from.
One type of chart is called a Trend chart or run chart. It’s utilized to show trends in data over time. Due to data fluctuations, single point measurements can be misleading. Displaying data over time increases understanding of the real performance, particularly with regard to an established target or goal.
Clicking on a Trend value graph icon in the No. of slow queries row will display a graph, depicting query performance over time.
Following is an example of a trend chart for the Master server:
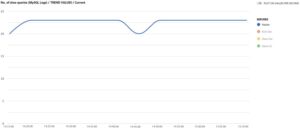
The SERVERS legend lists all of the servers from the SQL Logs screen. Each is assigned its own color for easy identification in the graph. Servers whose trend values do not appear in the graph are “greyed out”. Clicking a Server toggles its inclusion in the graph, thus saving having to return to the SQL Logs screen to select or deselect it. For example, the above graph was produced by clicking the Trend value graph icon in the Master column of the Monitors table. Hence, the other three servers are greyed out in the legend. Clicking any of these Servers will add it to the graph, while clicking the Master server will remove it from the graph.
Hovering the mouse over the graph line will display the details for that point on the graph:
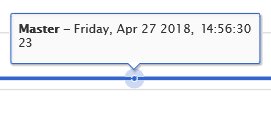
Clicking anywhere outside of the graph dialog closes the dialog.
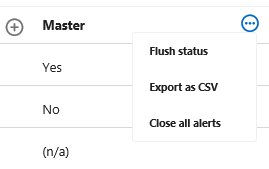
All charts and graphs displayed by the Monitors can be exported in CSV format. To export a chart select the option from the drop-down context menu.
Displaying Trend Values for a Specific Timeframe
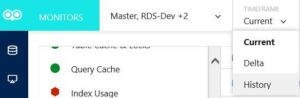
The trend graphs explored above presents the current trend data. In Monyog Professional, Enterprise and Ultimate editions, you can also select a specific time-frame for which to include in the graph by choosing the History item from the TIMEFRAME dropdown.
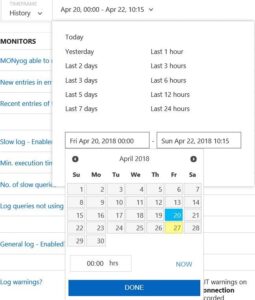
This will display an additional dropdown for selecting the timeframe range. It contains a number of intervals such as “Today”, “Yesterday”, and “Last 2 Days” as well as start and end fields to set a custom range. Clicking on either custom range fields presents a calendar widget for choosing an exact date and time.
Now, clicking on the ‘Trend Graph’ icon in the No. of slow queries row displays the trends graph.
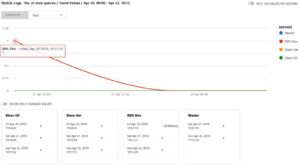
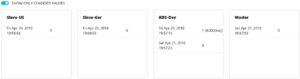
Along with the graph, the Historical Trend Graph also shows the monitor values for each server in tabular form underneath the graph. You can enable the option Show Only Changed Values to restrict values to those before and after changes.
Displaying Delta Results
The third type of Time Frame, Delta, displays results based on data for the period between the last data collection and the collection before that. This setting can help give you a better idea of the current situation, and how much it differs from the ‘average’ or ‘normal’ situation.
Query Analyzer
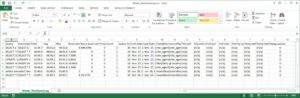
In the ‘Query Analyzer’ tab select which of the MySQL servers you want and the type of log (including the Slow Query log) you want to analyze. Next click the Analyze button to begin the analysis.
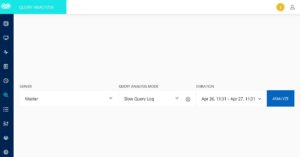
After a few seconds an analysis result like the following will appear:
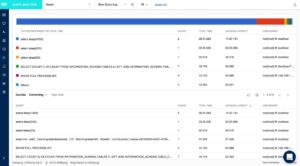
The Query Analyzer screen is divided into 2 parts: the top half of the screen contains the Top Queries based on Total Time while the bottom half shows all of the queries using results paging.
Top Queries based on Total Time
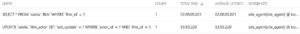
This section of the screen displays the top queries, sorted so that the slowest query appears at the top. It includes:
- The query statement
- COUNT: how many times the statement appears in the log.
- TOTAL TIME: How much time the queries took to execute, in hh:mm:ss:ms format.
- AVERAGE LATENCY: The average query execution time, in hh:mm:ss:ms format.
- USER@HOST: The user and host that executed the query.
Each statement is presented as a bar chart at the very top of the query data whereby each query is represented using a unique color. Each query’s Total Execution Time appears from left-to-right so that the slowest would be displayed at the far left. The bar chart helps to quickly assess how slow each of the slowest queries compares to the slowest. In the image above, we can see that the slowest query was several magnitudes slower than all of the other slow queries times combined!
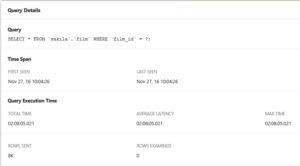
Clicking on a row brings up the Query Details. This includes additional information such as the query’s first and last seen date & times, its Max Time, Rows Sent, and Rows Examined:
This is also true of the Queries section.
Queries
The Queries section provides a more complete list of analyzed queries. In addition to having the ability to navigate through all of the queries via paging, it also features:
- Filtering:
Queries can be filtered to narrow down the list to those that you are interested in. The four filtering options are:- Containing
- Not containing
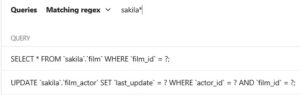
- Matching regex
- Not matching regex
Here is a filter that restricts results to statements that contain the regex “sakila*”:
- Sorting:
Rows can be sorted by any column by clicking the header. An arrow shows sorting order, i.e. ascending, descending.
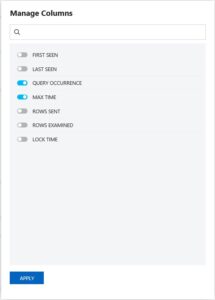
- Managing Columns:
Individual columns may be added and removed from the query list via the Manage Columns dialog:
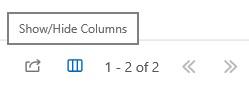
It’s accessible by clicking the Show/Hide Columns icon next to the Results Navigation controls:
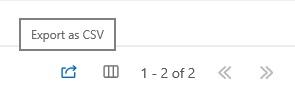
Export as CSV
To the immediate left of the Show/Hide Columns icon, the Export as CSV icon saves the query data to a Comma Separated Values (.csv) file.
CSV files may be read by applications like MS Excel.
Changing the Field Delimiter
The option to define the field delimiter is provided because some localized Windows programs that use the comma (,) as a decimal sign will require a semicolon (;) as field separator. This includes Microsoft Office programs like Excel and Access. On Linux, the situation is less uniform but some localized applications such as OpenOffice Calc (spreadsheet app) requires a semicolon (;) as the field separator.
Users can change the CSV export settings by using General > CSV EXPORT from the Settings screen.
Filter settings
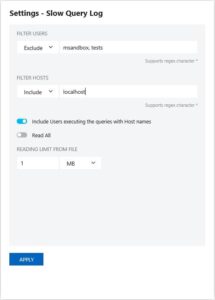
The Query Analyzer offers a few options specific to the Slow Query Log. These are accessible by clicking the Settings icon (highlighted in red below).
![]()
Options include:
- Filter Users/Filter Hosts:
A list of users/hosts to include or exclude from the analysis. Both these options accept the asterisk “*” wildcard character. - Include Users executing the queries with Host names:
If this option is selected it will display both the ‘user’ and ‘host’ of that particular query and it will group the query analyzer table based on ‘user@host’ and ‘query’. - Read All:
Selecting the Read All option causes the Query Analyzer to consider the whole file for analyzing. It won’t consider any particular timeframe but displays all queries within the specified KB, MB or bytes size/chunk as set in the Reading limit from file option. Otherwise, it reads the last specified chunk in KB, MB or bytes set in the Reading limit from file option in the log file. Note that it is the “smallest” of those two settings that will have effect for the analysis. - Reading limit from file:
Specifies the number of KB, MB or bytes size/chunk to read from the log file according to the Read All setting.
Conclusion
Both of the Slow Query Log and Performance Schema come with their own pros and cons. Whereas the slow query log is easy to work with and may be viewed with any text editor, the Performance Schema tables may be queried with regular SQL statements for a wide range of performance information. At the same time, both tools tend to produce a wealth of data that can be a burden to wade through.
That’s where a professional monitoring tool like Monyog can add tremendous value. Specifically:
- The Monyog Monitors page displays a detailed display of server parameters and metrics for the General Query, Slow Query and Error logs for monitored servers.
It provides Trend charts that show trends in data over time. The data timeframe may be current, historical, or a delta. - The Query Analyzer screen contains the Top Queries based on Total Time as well as a list of all queries using results paging.
Query profiling is a useful technique for analyzing the overall performance of a database. Employing Monyog to monitor the MariaDB Slow Query Log and the Performance Schema is one of the most efficient ways to do that.