
As tables increase in size and more and more users come online, it becomes increasingly necessary to fine-tune your database server from time to time. The secret to knowing what adjustments need to be made is to perform regular monitoring. Most databases offer dozens – if not hundreds – of performance metrics that you can assess.
In the earlier blog, we showed a number of ways to determine the cause(s) of MySQL database performance issues using a couple of built-in tools. With this two blog series, we will focus on monitoring key performance metrics. In part one, we’ll:
- examine the benefits of performance monitoring,
- outline the main performance metric categories
- list the monitoring tools provided by MySQL, i.e.:
- server variables
- the Performance Schema
- the sys Schema
- learn how to monitor:
- transaction throughput
- query execution performance
Benefits of Following a Monitoring Plan
Most applications are backed by a database – including MySQL. To keep your databases and applications running smoothly, it’s crucial to monitor them effectively. A good database monitoring plan can help you stay on top of:
- Performance: The main subject of this whitepaper, monitoring your database’s performance can help detect possible bottlenecks and other issues before catastrophe strikes. Beyond helping you avert emergencies, performance metrics can assist you in deciding whether a performance increase is necessary or feasible. For instance, by keeping a track record of query execution times you could spot any suboptimal SQL statements and come up with possible improvements.
- Growth: Observe requirements in terms of users and traffic. Database usage needs tend to evolve faster than expected.
- Security: Ensure adequate security measures have been applied.
Database Metric Types
Before we go through the process of identifying metrics to follow, perhaps we should start at the beginning and ask “what are metrics?”
Metrics capture a value pertaining to your systems at a specific point in time — for example, the number of users currently logged into the database.
Therefore, metrics are usually collected at regular intervals, such as once per second, one per minute, etc., in order to monitor a system over time.
There are two important categories of metrics: those that are most useful in identifying problems and those whose primary value is in investigating problems. This whitepaper covers which data to collect so that you can:
- Recognize potential problems before they occur.
- Quickly investigate and get to the bottom of performance issues.
Beyond metrics, there are other types of database monitoring that will not be addressed here. These include the monitoring of events and security.
How often should Monitoring be performed?
How often you monitor different aspects of your database depends on how mission-critical it and the application(s) that it supports are. If a failure or disruption will result in serious impact on your business operations and/or organization, or perhaps even result in catastrophe, then you need to be on top of both performance (and security) issues at all times. Luckily, you can reduce your need to constantly monitor your performance dashboard to a weekly inspection by setting up alerts to inform you of critical issues in real-time.
Database performance metrics should be monitored by specialized tools that provide real-time and/or periodic alerts. Real-time alerts are a must for any mission-critical databases or databases with sensitive information that is susceptible to attack so that you can take care of urgent issues as soon as they occur. Real-time preventive measures can protect your database from certain types of attack, even before you have time to respond.
The DBAs, IT operations staff, and users have shared responsibility in performance monitoring since some factors that affect database performance lie beyond the database itself. It also makes sense to include some of the app developers in the loop so that they can investigate the application side of things.
Although DBAs do not need to monitor the applications that interact with the database, it’s important that they possess a general understanding of how applications are implemented and their architecture.
Performance Metric Categories
The previous section described the two main uses of database metrics – problem identification and problem investigation. Likewise, there are two important categories of metrics that pertain to performance: work metrics and resource metrics. For each system that is part of your software infrastructure, consider which work metrics and resource metrics are applicable and available, and collect whatever you can. Even though you won’t need to monitor every metric, some may play a greater role once you’ve identified performance issues – i.e. during problem investigation.
The next two sections cover each of the two performance metric types in more detail.
Work Metrics
Work metrics gauge the top-level health of your database by measuring its useful output. Work metrics may be broken down into four subtypes:
- Throughput: The amount of work the system is doing per unit of time. Throughput is usually recorded as an absolute number. Examples include the number of transactions or queries per second.
- Success: Represents the percentage of work that was executed successfully, i.e. the number of successful queries.
- Error: Captures the number of erroneous results, usually expressed as a rate of errors per unit of time. This yields errors per unit of work. Error metrics are often captured separately from success metrics when there are several potential sources of error, some of which are more serious or actionable than others.
- Performance: Quantifies how efficiently a component is doing its work. The most common performance metric is latency, which represents the time required to complete a unit of work. Latency can be expressed as an average or as a percentile, such as “99% of requests returned within 0.1s”.
The above metrics provide high-level but telling data that can help you quickly answer the most important questions about a system’s internal health and performance. That is to say:
- Is the database available and effectively doing what it was designed to do?
- How fast is it producing work?
- What is the quality of that work?
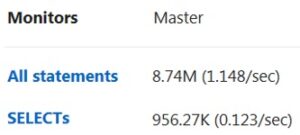
Below are examples of each of the four work metric subtypes from the Monyog monitoring tool:
Resource Metrics
Resources are hardware, software, and network components that are required by the database to do its job. Some resources are low-level, such as physical components like CPU, memory, disks, and network interfaces. Higher-level resources such as the query cache and database waits can also be considered a resource and therefore monitored.
Resource metrics are useful in helping you reconstruct a detailed picture of the database’s state, making them especially valuable for investigation and diagnosis of problems. Resource metrics cover four key areas:
- Utilization: The percentage of time that the database is busy, or the percentage of the database’s capacity that is in use.
- Saturation: A measure of the amount of requested work that the database cannot yet service, and waits in the queue.
- Errors: Represents internal errors that may or may not be observable in the database’s output.
- Availability: Denotes the percentage of time that the database responded to requests.
Here are some examples of resource metrics:
Monitoring Performance
Both Work and Resource metrics include two types of metrics as follows:
Work Metrics:
- Database/Transaction/Query throughput
- Query execution performance
Resource Metrics:
- Connections
- Buffer pool usage
The next several sections will focus on some of the best Work metrics to monitor. Resource metrics will be covered in Part 2.
Throughput
In general terms, throughput measures the speed of a database system, and is typically expressed as a number of transactions per second. Having said that, consider the following differences:
- “write” transactions vs. “read” transactions
- sustained rates vs. peak rates
- a 10-byte row vs. a 1000-byte row
Due to these differences, it is best to measure:
- Database Throughput: the database as a whole
- Transaction Throughput: any operation
- Query Throughput: query execution
Throughput Metrics in MySQL
Indeed, MySQL provides Throughput metrics for all of the above transaction types.
The Questions and Queries Status Variables
There are two general MySQL Status Variables for measuring query execution: Questions and Queries. Of the two, the client-centric view provided by the Questions metric often makes it easier to interpret than the Queries counter; the latter also counts statements executed as part of stored programs, as well as commands such as PREPARE and DEALLOCATE PREPARE that run as part of server-side prepared statements.
SHOW GLOBAL STATUS LIKE "Questions"

Variable_name  Value

--------------------

Questions      66


SHOW GLOBAL STATUS LIKE "Queries";

Variable_name  Value

--------------------

Queries        149
You can also monitor the breakdown of read and write commands to better understand your database’s workload and identify potential bottlenecks. Read queries are generally captured by the Com_select metric. Writes increment one of three status variables, depending on the statement type:
Writes = Com_insert + Com_update + Com_delete
SHOW GLOBAL STATUS LIKE "Com_select";

Variable_name  Value

--------------------

Com_select     49
When are MySQL Counters Incremented?
While the MySQL docs do list all of the various counter variables, they do not describe in detail when exactly each counter is incremented. This might seem like a trivial point, but really it is not, especially if you’re capturing metrics with high resolution in order to diagnose MySQL performance incidents.
For instance, if you would count queries when they start, a spike in the number of queries in a given second could be due to an increase in traffic. However, if you measure queries at the completion, spikes could be caused by some critical resource becoming available, which allowed for many queries to complete. This often occurs with table-level locks or row-level locks on InnoDB.
In the case of MySQL, it increments the Questions and Queries counters BEFORE executing the query. As a result, you may see a very uniform rate of questions when actually a lot of queries were started but were not completing quickly due to waiting on some resource.
The threads_running Status Variable
To check for unusual numbers of queries running concurrently and struggling to complete in time, it can be instructive to look at the Threads_running status variable.
SHOW GLOBAL STATUS LIKE "Threads_running";

Variable_name   Value

---------------------

Threads_running 29
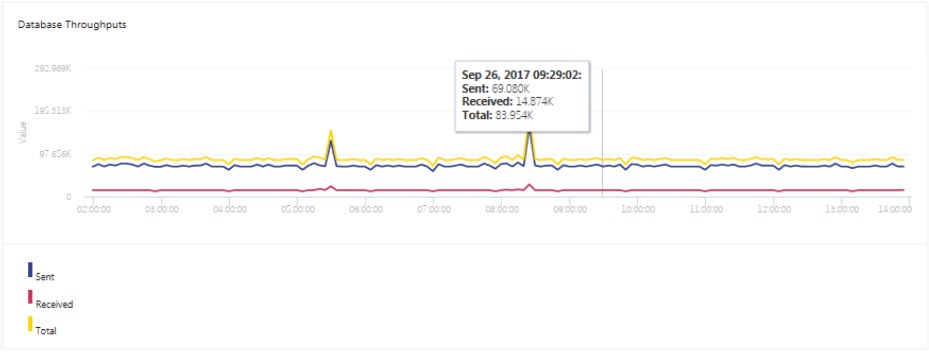
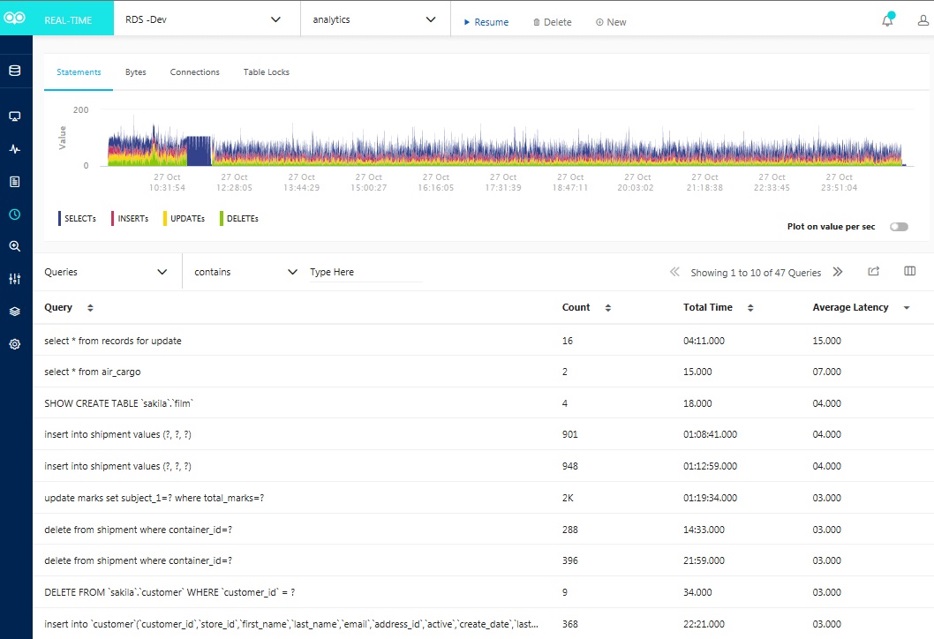
A professional monitoring tool can present throughput metrics as a graph to make peaks and valleys more readily apparent:
Query Execution Performance
Measuring query execution performance is all about finding those queries that take too long to identify the required data or bring the data back. One of the best metrics to gauge query speed is Latency. In terms of query execution, latency is simply the amount of time it takes a query to execute and return a result set, in other words, the time to make one round trip.
MySQL provides a few options for monitoring query latency, including built-in metrics and the performance schema. Enabled by default since MySQL 5.6.6, the tables of the performance_schema database within MySQL store low-level statistics about server events and query execution.
The slow_queries Server Variable
It stores the number of queries that have taken more than long_query_time seconds. What’s great about this counter is that it increments regardless of whether the slow query log is enabled. That’s a good thing because the slow query log is disabled by default because logging can place a bit of a drag on performance.
SHOW GLOBAL STATUS LIKE "Slow_queries";

Variable_name  Value

--------------------

Slow_queries   99
The Performance Schema
Many key metrics are contained in the performance schema’s events_statements_summary_by_digest table, which captures information about query volume, latency, errors, time spent waiting for locks, and index usage. These metrics and more are available for each SQL statement executed. Statements are presented in normalized form, meaning that data values are removed from the SQL and whitespace is standardized.
This query finds the top 10 statements by longest average run time:
SELECT substr(digest_text, 1, 50) AS digest_text_start

     , count_star

     , avg_timer_wait

  FROM performance_schema.events_statements_summary_by_digest

 ORDER BY avg_timer_wait DESC

LIMIT 10;

digest_text_start 					   count_star	        avg_timer_wait

----------------------------------------------------------------------------------------------

SHOW FULL TABLES FROM `sakila` 				        1		1110825767786

SHOW GLOBAL STATUS LIKE ? 					1		1038069287388

SELECT `digest_text`, `count_star`, `avg_timer_w		1		945742257586

SHOW FIELDS FROM `sakila` . `actor` 				1		611721261340

SELECT `digest_text` , `count_star` , `avg_timer_w	        2		335116484794

SHOW FIELDS FROM `sakila` . `actor_info` SELECT `a       	1		221773712160

SELECT NAME , TYPE FROM `mysql` . `proc` WHERE `Db       	2		148939688506

SHOW FIELDS FROM `vehicles` . `vehiclemodelyear`        	1		144172298718

SHOW SCHEMAS 					  		2		132611131408

SHOW FIELDS FROM `sakila` . `customer` 		        	1		99954017212
A Note about Event Timer Units
Performance Schema displays event timer information in picoseconds (trillionths of a second) to present timing data in a standard unit. In the following example, TIMER_WAIT values are divided by 1000000000000 to convert time data into seconds. Values are also truncated to 6 decimal places:
SELECT substr(digest_text, 1, 50) AS digest_text_start

     , count_star

     , TRUNCATE(avg_timer_wait/1000000000000,6)

  FROM performance_schema.events_statements_summary_by_digest

 ORDER BY avg_timer_wait DESC

LIMIT 10;

digest_text_start 					    count_star	   avg_timer_wait

-----------------------------------------------------------------------------------------

SHOW FULL TABLES FROM `sakila` 				        1		1.110825

SHOW GLOBAL STATUS LIKE ? 					1		1.038069

SELECT `digest_text`, `count_star`, `avg_timer_w	        1		0.945742

etc…
Now we can easily see that the longest query took a little over 1 second to run.
The sys Schema
Rather than write SQL statements against the performance schema, it is generally easier to use the sys schema. It contains easily interpretable tables for inspecting your performance data.
The sys schema comes installed with MySQL starting with version 5.7.7, but users of earlier versions can also install it. For instance, to install the sys schema on MySQL 5.6, run the following commands:
git clone https://github.com/mysql/mysql-sys.git
cd mysql-sys/
mysql -u root -p < ./sys_56.sql
The sys schema provides an organized set of metrics in a more human-readable format, making the corresponding queries much simpler. For instance, to find the slowest statements (those in the 95th percentile by runtime), run the following query:
SELECT * FROM sys.statements_with_runtimes_in_95th_percentile;
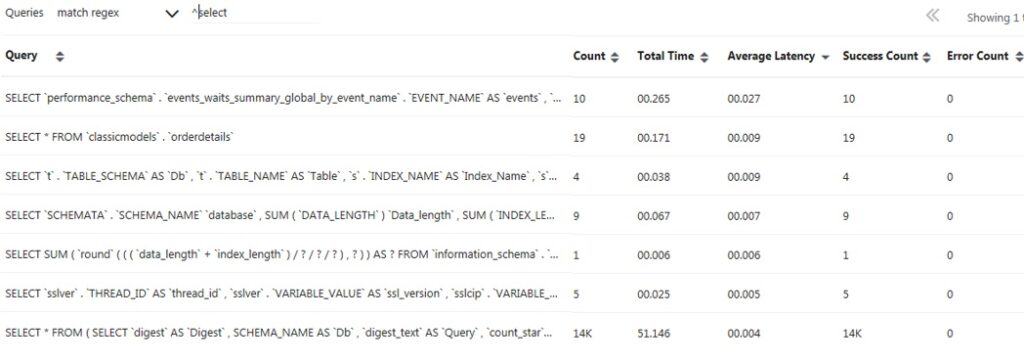
Here again, a professional monitoring tool can really pay dividends by consolidating various performance metrics into one cohesive view:
Conclusion
This whitepaper is the first of a two-part series on the top MySQL performance metrics. In Part 1, we learned:
- To keep your databases and applications running smoothly, it’s crucial to monitor them effectively.
- There are two important categories of metrics: those that are most useful in identifying problems and those whose primary value is in investigating problems.
- How often you monitor different aspects of your database depends on how mission-critical it and the application(s) that it supports are.
- There are two important categories of metrics that pertain to performance: work metrics and resource metrics.
- Both Work and Resource metrics include two types of metrics as follows:
Work Metrics:
-
- Throughput
- Query execution performance
Resource Metrics:
- Connections
- Buffer pool usage
- There are two general MySQL Status Variables for measuring query execution: Questions and Queries. Of the two, the client-centric view provided by the Questions metric often makes it easier to interpret than the Queries counter.
- MySQL provides a few options for monitoring query latency, including its built-in metrics and the performance schema. Enabled by default since MySQL 5.6.6, the tables of the performance_schema database within MySQL store low-level statistics about server events and query execution.
- Many key metrics are contained in the performance schema’s events_statements_summary_by_digest table, which captures information about query volume, latency, errors, time spent waiting for locks, index usage.
- The sys schema contains easily interpretable tables for inspecting your performance data.
Part two of the blog series will focus on Database Connections and Buffer Pool metrics.
Monyog is a MySQL monitoring tool that improves the database performance of your MySQL powered systems. Download your free trial.